ANOMALY DETECTION
Outliers can lead to a myriad of problems when you implement different kinds of algorithms for learning, and different ways to deal with outliers are discussed in Outlier Treatment. However, a machine-learning technique called Anomaly Detection can be utilized to find outliers. The definition of outliers is defined as observations that do not match the majority of information. This is why different machine learning algorithms attempt to discover the instances which differ from the bulk of data, which could make us think they may be outliers.
There are generally three kinds of Anamoly Detection setups: Supervised, Semi-supervised and Unsupervised.
SUPERVISED ANOMALY DETECTION
It is like the classification problems discussed in the supervised Modeling section. This is a labeled dataset, where the variable Y is binary, with one label that indicates the outlier. This is why you will find labels to describe normal as well as abnormal data. We then employ different algorithms for learning to master the function or apply another method to determine which type of data is associated with an anomaly. After thorough evaluation and validation, apply this model to identify anomalies in data that are not visible. So, generally speaking, the class that is associated with anomalies is rare, and none of the techniques for supervised binary classification can be used for this.
SEMI-SUPERVISED ANOMALY DETECTION
This method of detection of anomalies is applied in the case of data that is free of anomalies. The data that we can say to be clean is able to be used to study something that lets us, at a minimum, know what normal-looking data appears like. Therefore, we can apply this model to analyze unclean data and determine the data that isn’t like the data we are sure is clean and label them as abnormal. It’s not as effective as the Supervised method, but it’s better than having nothing at all, as is the situation with Unsupervised Anomaly detection.
UNSUPERVISED ANOMALY DETECTION
This is the most typical situation we encounter when we have a data set to work with but do not have any particular field of expertise to determine outliers in the data that might contain. Finding anomalies under such a setup is very tough as the data at hand can be good or bad and riddled with outliers/noise/anomalies. We can only assume that our data contains only a few outliers and that something has to be done before creating any data model from it.
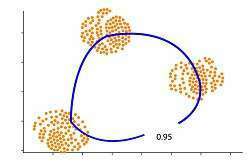
But, if it is dirty such as if half of it is an ‘anomaly,’ there’s no way to determine it. In the case of the example, if we have a data set that forms two clusters and data diverge from these two clusters, they can be recognized as anomalies. But, if we’ve got lots of anomalies, and result in their own cluster, then it’s going to be very difficult to identify the anomalies as being outliers.
There are a variety of unsupervised anomaly detection methods like Kernal Density Estimation one-class support vector machines Isolation Forests and Self Organising maps, C Means (Fuzzy C Means) local outlier factor, K means unsupervised Niche (UNC), etc.
The blog below discusses methods like Kernel Density Estimation, one-class support vector Machines, and Isolation Forests.

Different models of unsupervised learning are discussed in this blog, which can be used to find the irregularities. These anomalies are regarded as outliers and could be modified in order to ensure that the information is clearer and stable. There are a variety of unsupervised models. In this blog, the Kernal Density Estimation, One-Class Support Vector Machine, and Isolation Forests were discussed, along with the impact of the various parameters employed by these models to assist in recognizing anomalies.
