Measures of Frequency are the earliest and the most fundamental type of descriptive statistics that could be performed on any datasets. These kinds of statistics are typically performed in Univariate and Bivariate Analyses for describing categorical variables. When it comes to Measures of Frequency, the analysis is carried out by taking the categories of the variable (i.e., by recording the number of times that each category of the variable was repeated) and then formulating percentages from these numbers.
The most effective method of understanding the entire concept is using an example and then applying the concepts under Measures of Frequency.
For instance, we have a database with two variables: State and Country.
First, we can count the frequency of categories in a given variable and create a frequency table. First, we start with the variable “State” (This is a one-way analysis because the only variable considered).

Based on the frequencies table, we are able to create various charts to aid us in describing the data.
We can use Bar graphs to show what frequency is present in each category in the variable “State.”

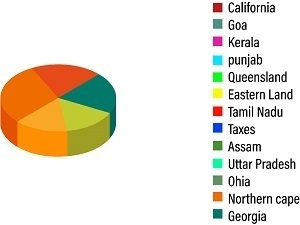
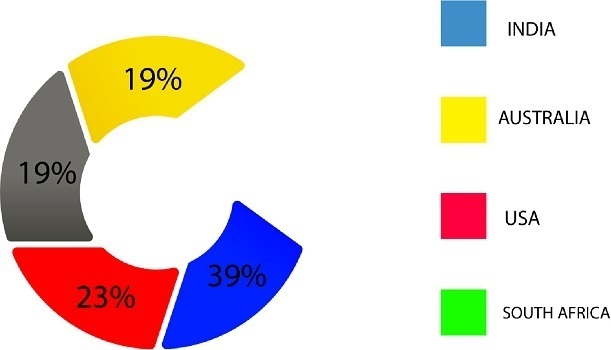
It is also possible to employ pie charts to explain the frequency of different types of variables.

We can also study the frequency using a cross-frequency table to examine the frequency from two different variables (Such an approach is referred to as Bivariate analysis since two variables are included in the study).

Stacked Bar graphs can also be designed to show the connections between categories of variables.

You can also use percentages to determine the proportion of the various categories.

We can also see that the frequency in each category aids us in understanding the information. But it’s the most basic type of descriptive statistics. To get more information, we need to utilize other types of statistics.


