Overview
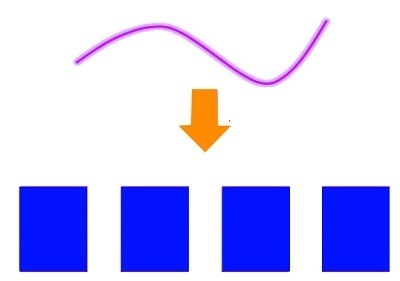
Binning refers to the creation of new categorical variables using numerical variables. Discretization can also be used to describe the process of converting continuous functions, models, and variables into discrete counterparts.
Use of Binning in Data mining
There are many examples of binning. For example, if the city’s population is between 0-9 and 10-20 years old, it can be found that the average age of its residents is between 21-39 and 40-59. 60-89 to 90+. It takes place between feature creation, feature transformation, and even converting a numerical feature into a categorical one. There are many reasons why this transformation might be necessary. Sometimes, the analyst must read between the lines. They must look at patterns or effects in the data caused by human involvement and formulate implementation strategies. This is an example if we analyze the marks of grade 10 students and see a correlation between their IQ and marks. This means that new methods or study materials cannot be developed for every student with different intelligence. We can use the 4 groups of students to determine their IQ and create a new study method for each group. The implementation aspect of feature engineering must also be considered.
Binning helps improve the reliability of different models, particularly linear and predictive. They help reduce noise (unexplained/random points in the data) and nonlinearity in the data. Similarly to other transformation techniques, binning can also help us control outliers. This is especially true when supervised binning is used (mentioned above), where a decision-tree in python is used. We can also use it to detect outliers. Overfitting is a common problem in modeling. It allows the model to avoid trying to draw inferences that are not based on values that are very similar.
These characteristics can be used to help with outliers and non-linear relationships. Binning also includes feature transformation techniques. It can also be described as a type of variable transformation. It has been added to this blog post under Feature Construction because the variable that is being created here is also Binning.
It refers to a process where numerical features can be converted into categorical features.

Types of Binning in Data mining
It can either be classified as Unsupervised or Supervised.
Supervised Binning
Supervised binning involves the target variable, commonly called the ‘Y variable.’ It is performed keeping in mind the variable’s different categories (also known as the class label, which are discrete attributes whose values we want to predict) and the Y variable itself (also known as the ‘Y variable’). Entropy-based binning is one of the most popular techniques. ID3 uses Entropy to split variables that provide maximum information. These splits are based on class labels, making the bins correspond with the same class label. (More information on Entropy can be found in the blog- Decision Trees).
Unsupervised Binning
This is the simplest and easiest form of binning, where target variables are not considered. Only the values of a variable can be used to divide them and convert them into other categories. Equal Width Binning is the most popular unsupervised Binning. Here, the feature values are divided into “k intervals equal size”; the interval size is uniform across. Unsupervised Binning can also be used when a variable has 10 values. This is accomplished by dividing the values into k groups. Each group has nearly the same number of values. For example, if the feature contains 10 values and we create 5 segments, each segment or group will have two values. This is called Equal Frequency Binding. Frequency tables can be used to create bar graphs showing the results of this type of it.

Rankings and Quantiles
Binning can also be done using other methods, such as Quantiles and Ranks. The ranking is achieved by sorting data and assigning ranks to each value. These ranks will indicate the value’s size/weight of other features. Quantiles can also be used for binning using Quartiles (Quintiles), Percentiles, and so on. This is covered in Descriptive Statistics. Each of these methods has its limitations. Ranking will give different ranks to the same value (due to duplicate) and can cause the same rank to be changed if the data is altered. This is also a drawback to Quantile.
Binning is a way to organize data into neat ranges. It is a good idea if the buckets aren’t clear, or you need high precision.


